Emily Lakdawalla • Oct 22, 2012
DPS 2012: The most detailed images of Uranus' atmosphere ever
Experience has shown that the most useful way to get through a backlog of notes from a productive conference is to write up the most interesting results in bits and pieces. So here's a nugget from the Thursday afternoon poster session at last week's Division for Planetary Sciences meeting in Reno, Nevada.
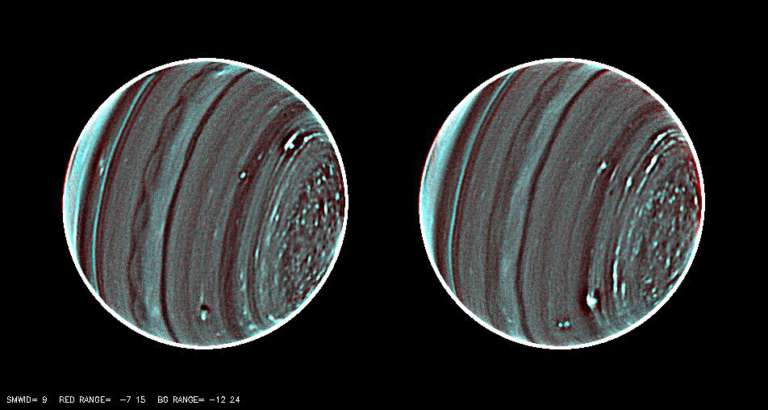
Let's begin with this pair of images, which attracted me from several meters away. They were printed on a poster presented by Patrick Fry, Larry Sromovsky, Kathy Rages, Heidi Hammel, and Imke de Pater. It was hard to believe what I was seeing, and as I turned to look for one of the authors, I found another planetary astronomer, Leigh Fletcher, staring at the same pictures in open-mouthed amazement.

You are seeing fine-scale structure in the atmosphere of Uranus, in images containing vastly more detail than anything achieved by Voyager or Hubble. Voyager was handicapped at Uranus and Neptune (not to mention Titan) by its blindness to infrared wavelengths; the opacity of methane at shorter wavelengths frustrated its ability to see even the highest-level cloud structure.
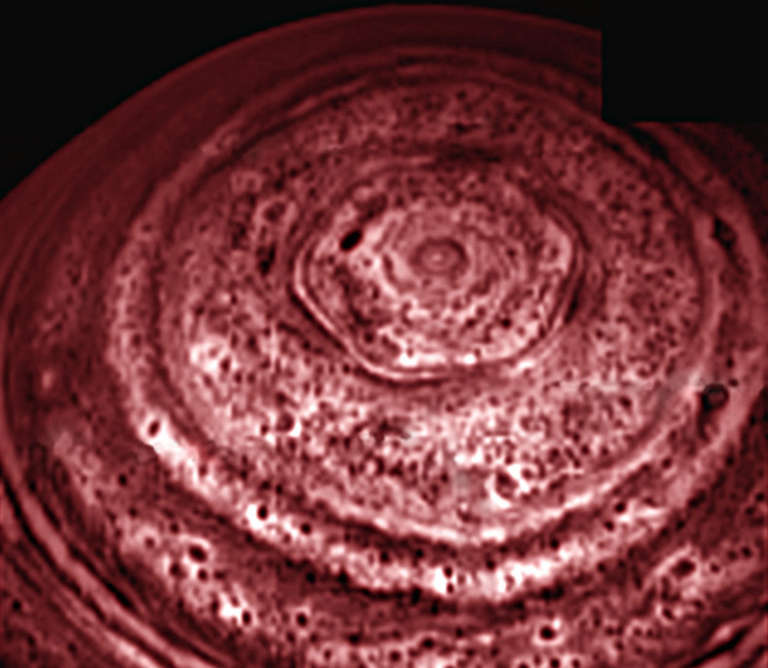
Sitting comfortably on Earth, the adaptive-optics-equipped Keck II telescope employed its NIRC2 camera to take these images. There is astonishing structure visible here. Near the equator, there's a beautifully rhythmic wave structure in one cloud belt. Near the north pole (at right), there's a mottled texture of high clouds and atmospheric holes that looks shockingly similar to an infrared view of Saturn's pole (which I wrote a lengthy post about in May 2010):

It was only after a conversation with Larry Sromovsky (involving Leigh as well) that I came to understand how much processing lies behind these "images." Several techniques were required to bring out what are, in fact, very subtle (but clearly coherent) details.
The left image is actually composed of 117 exposures, the right 118. It has become quite common in astronomy to take large numbers of images at a fairly rapid rate and then stack them (or a subset of the sharpest ones) in order to bring out details. "Stacking" essentially means that you carefully align the images and then average them. This method accomplishes two things: it helps reduce the effects of random noise, and it sharpens the images.
Sromovsky explained that they did stack the images, but not before doing some preliminary work. Uranus rotates pretty quickly. The images shown here are about 350 pixels across, so Uranus' circumference is roughly 1000; divide that by the 17-hour rotation rate and you get roughly 60 pixels per hour, or one per minute. The smallest features I see here are a few pixels across; they'd be hopelessly smeared after a few minutes of imaging unless the rotation were accounted for.
That's pretty easy to fix, in a bit of work that's quite common in image processing. You "reproject" the images to flat maps. A view of Uranus from Earth is essentially an orthographic map projection. Convert each image from an orthographic to some cylindrical map projection. Then shift images left or right to account for Uranus' rotation. (I should be able to figure out whether it's left or right as time increases but Uranus, with its upside-down or retrograde-ness, gets me tied up in directional knots and I'd be guaranteed to pick the wrong one.)
But wait, it's more complicated than that. Uranus' visible "surface" is not a solid body; it's a hydrodynamically circulating atmosphere. Like all self-respecting giant planets, its winds move at different rates at different latitudes. So there's a second-order correction that the astronomers had to do, warping the image by shifting lines of pixels at different latitudes left or right, depending upon the observed zonal wind speeds. What are the wind speeds on Uranus? In fact, it's the same group of astronomers who figured out the answer to that question, publishing the (currently) definitive paper on Uranus' wind speeds as observed from cloud motions. Here's the graph:

The difference in wind speeds between the northern midlatidues and the equator is 300 meters per second, or about 1000 kilometers per hour. Uranus' circumference is about 300,000 km, so one degree is roughly 1000 km; so for every hour, there's about one degree -- about three pixels' worth -- of shear, moving midlatitude features to the east with respect to equatorial features. This is not as big a correction as the rotational one, but it was clearly significant enough for them to apply it.
Only then did they stack all the images. And even then, one further step was applied. Most of the variation in pixel values in their stacked composite was from broad-scale atmospheric banding. They high-pass filtered the composite to remove the broad features, leaving only the smaller, more local features.
The detail is lovely. But what does it all mean? The answer to that question is: they don't know yet. There are some guesses and hypotheses, but as with everything else in space science, achievement of new detail in observations generates more questions than it does answers. Which is one of the things that makes space science so fun!
Let’s Go Beyond The Horizon
Every success in space exploration is the result of the community of space enthusiasts, like you, who believe it is important. You can help usher in the next great era of space exploration with your gift today.
Donate Today

 Explore Worlds
 Find Life
 Defend Earth

